Focused on maximizing total shareholder return
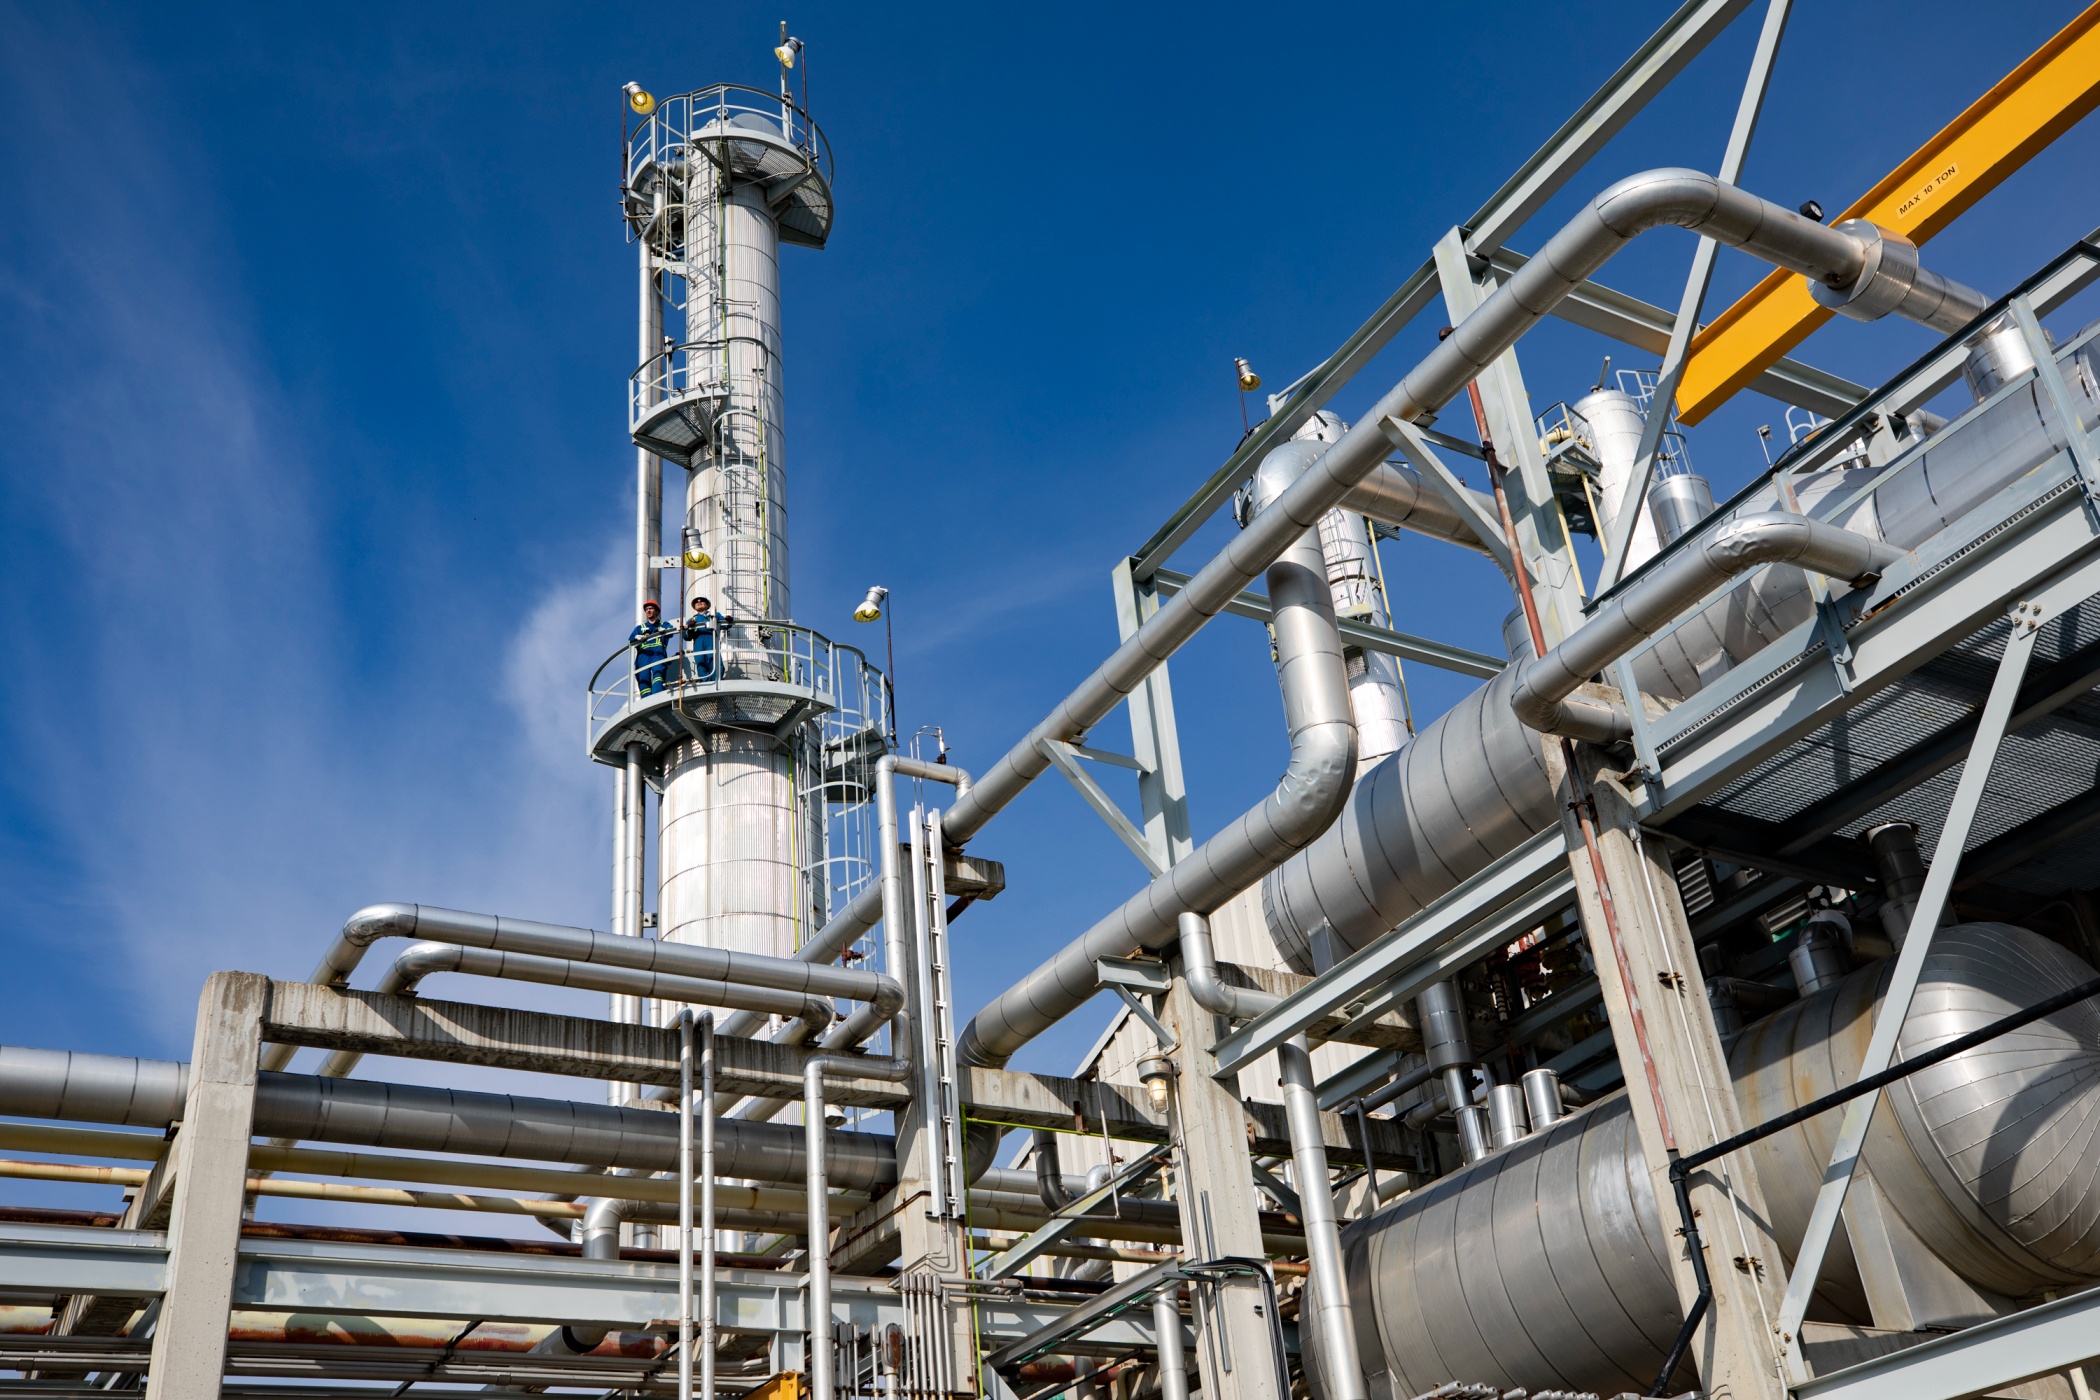
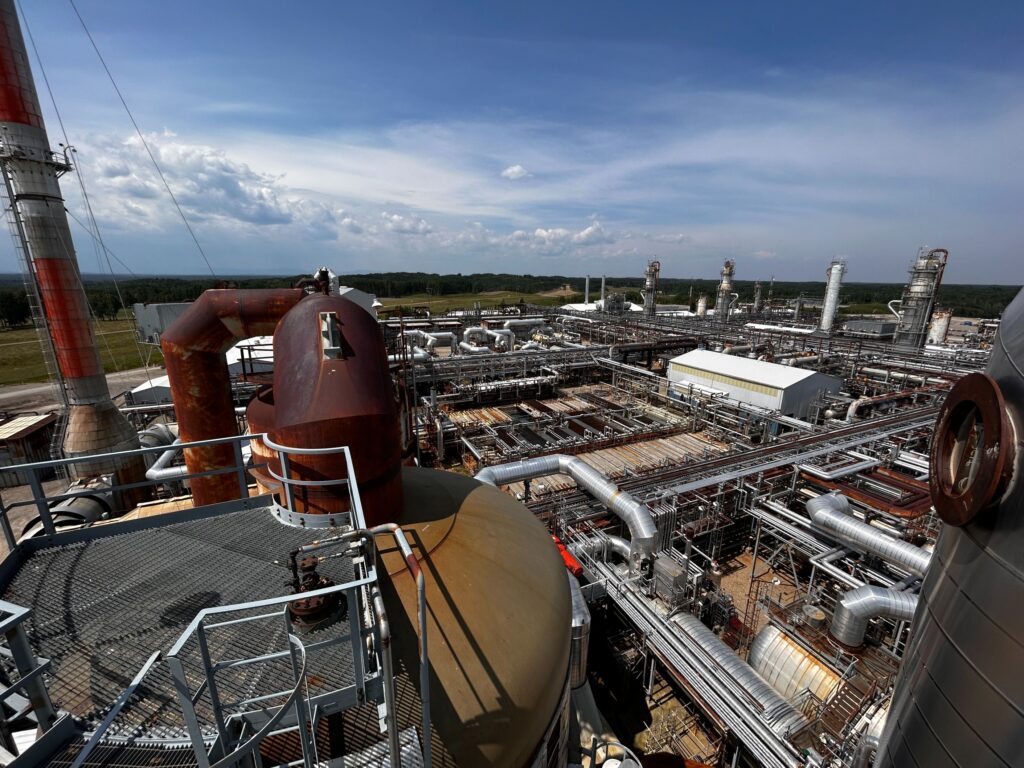
We are a significant upstream producer and midstream custom processor of natural gas, natural gas liquids, condensate, and sulphur in Alberta and Northeast British Columbia. Situated in the Canadian Foothills, we are uniquely positioned to optimize exposure to key North American natural gas and natural gas liquids markets and pricing points.
Growing a stable, fee-based revenue stream, we are focused on expanding custom third-party natural gas and NGL processing at our deep-cut gas processing facilities. Leveraging our extensive gas gathering system.
Through disciplined growth, quality decision-making, and skilled execution, our company is well-positioned to deliver value to shareholders.
Latest Presentation
Get up-to-date financial data and important current information.
Conference Call
Conference Call and Webcast on Q1 2026 Results,
With President & Chief Executive Officer Darcy Reding and Chief Financial Officer Adam Gray
Date: Friday, May 8, 2026
Time: 1:30 p.m. MDT / 3:30 p.m. EDT.
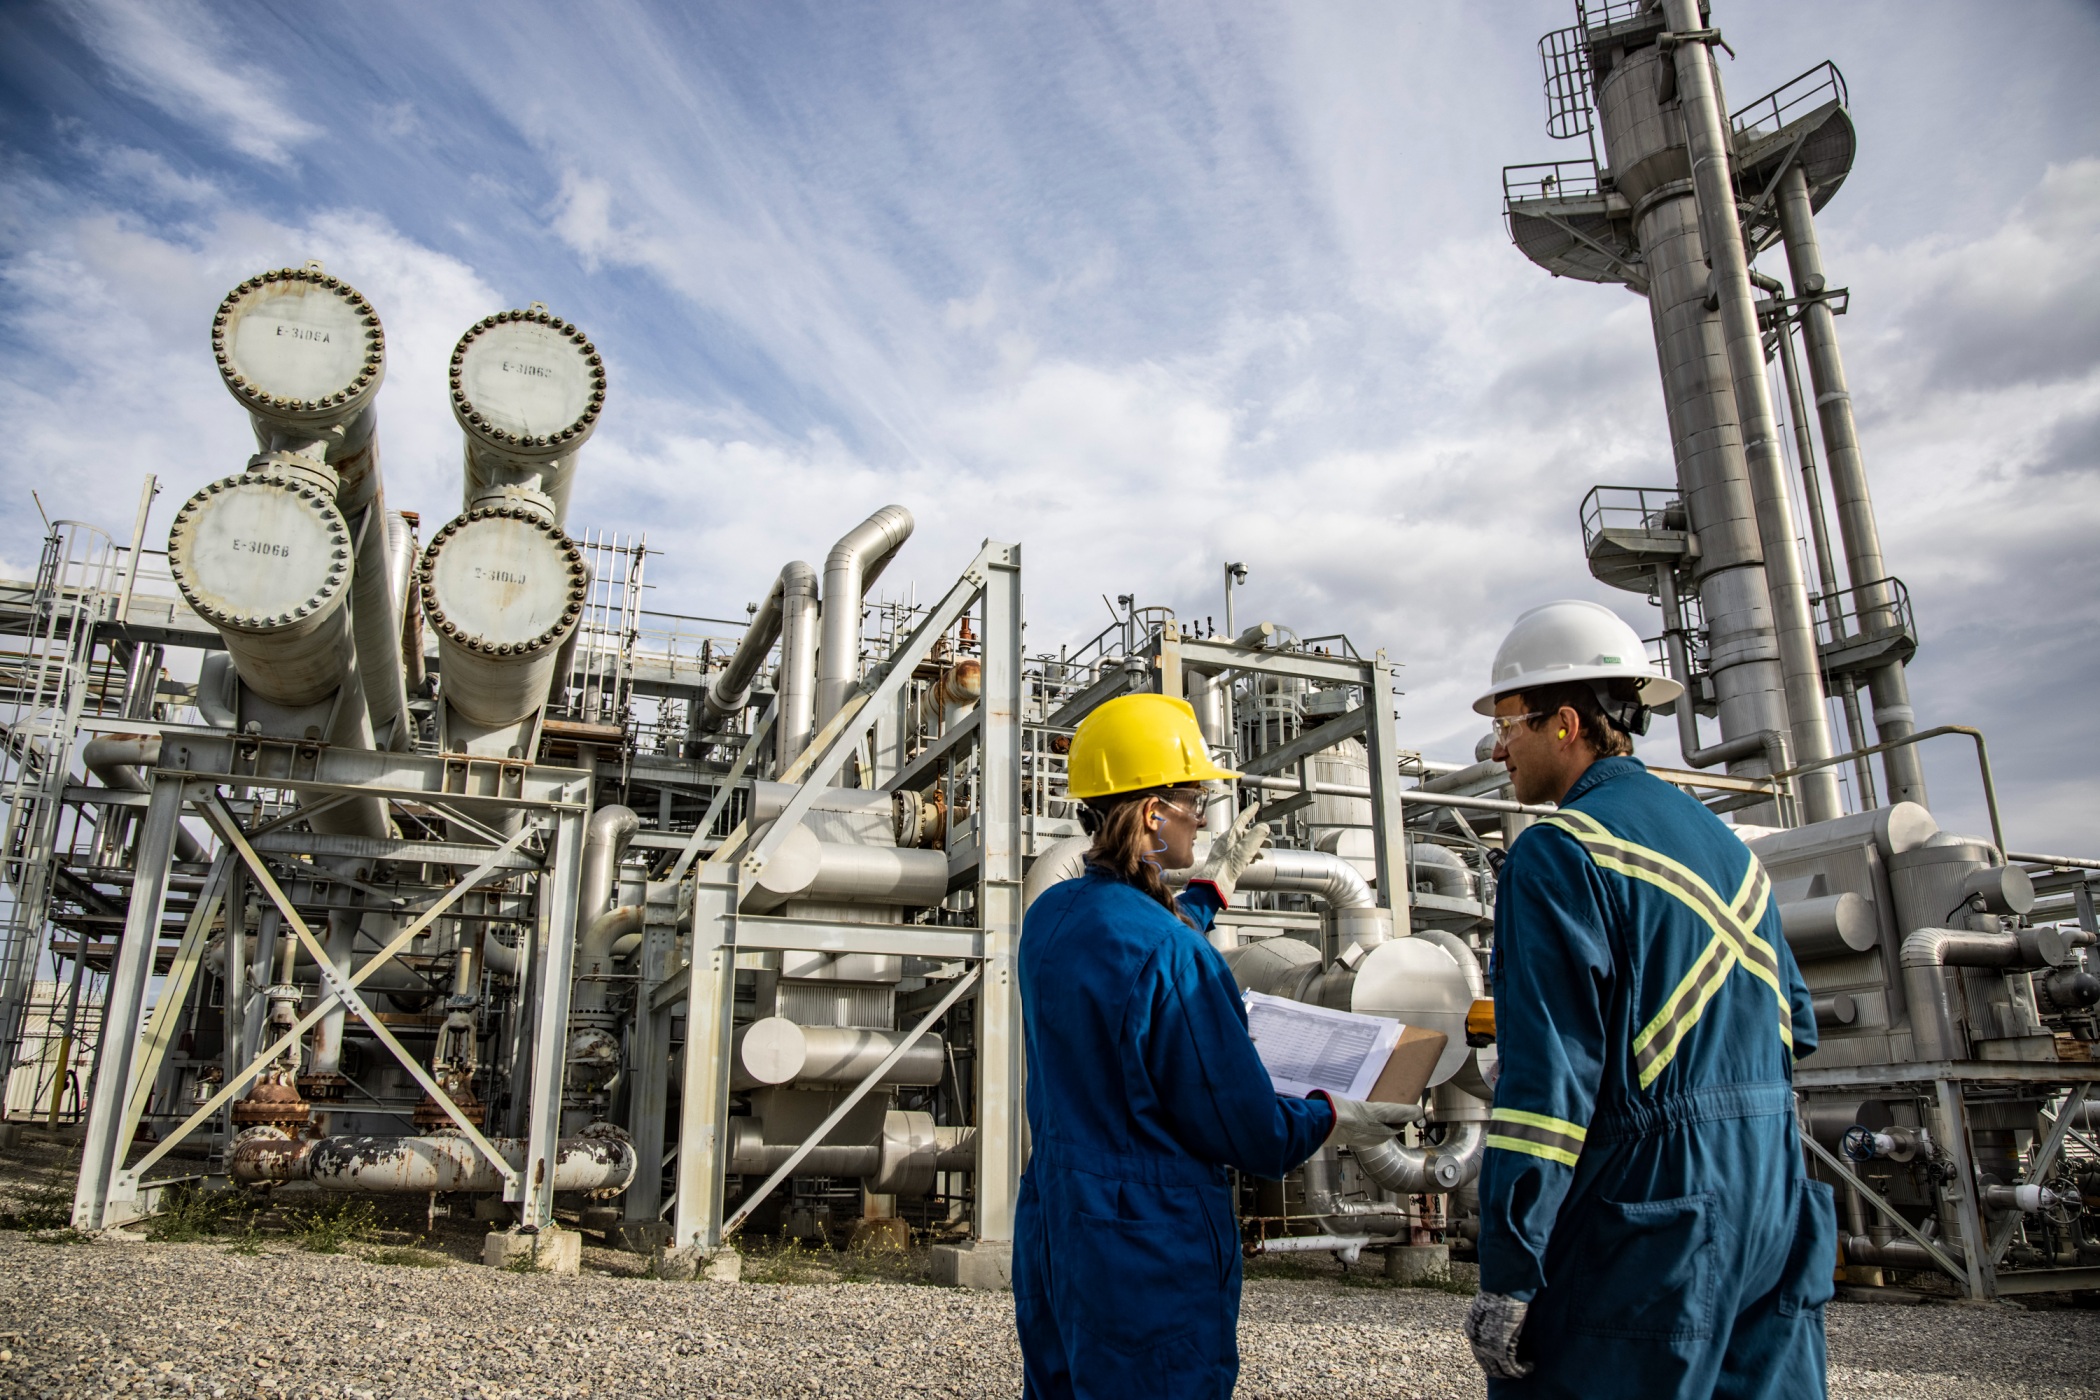
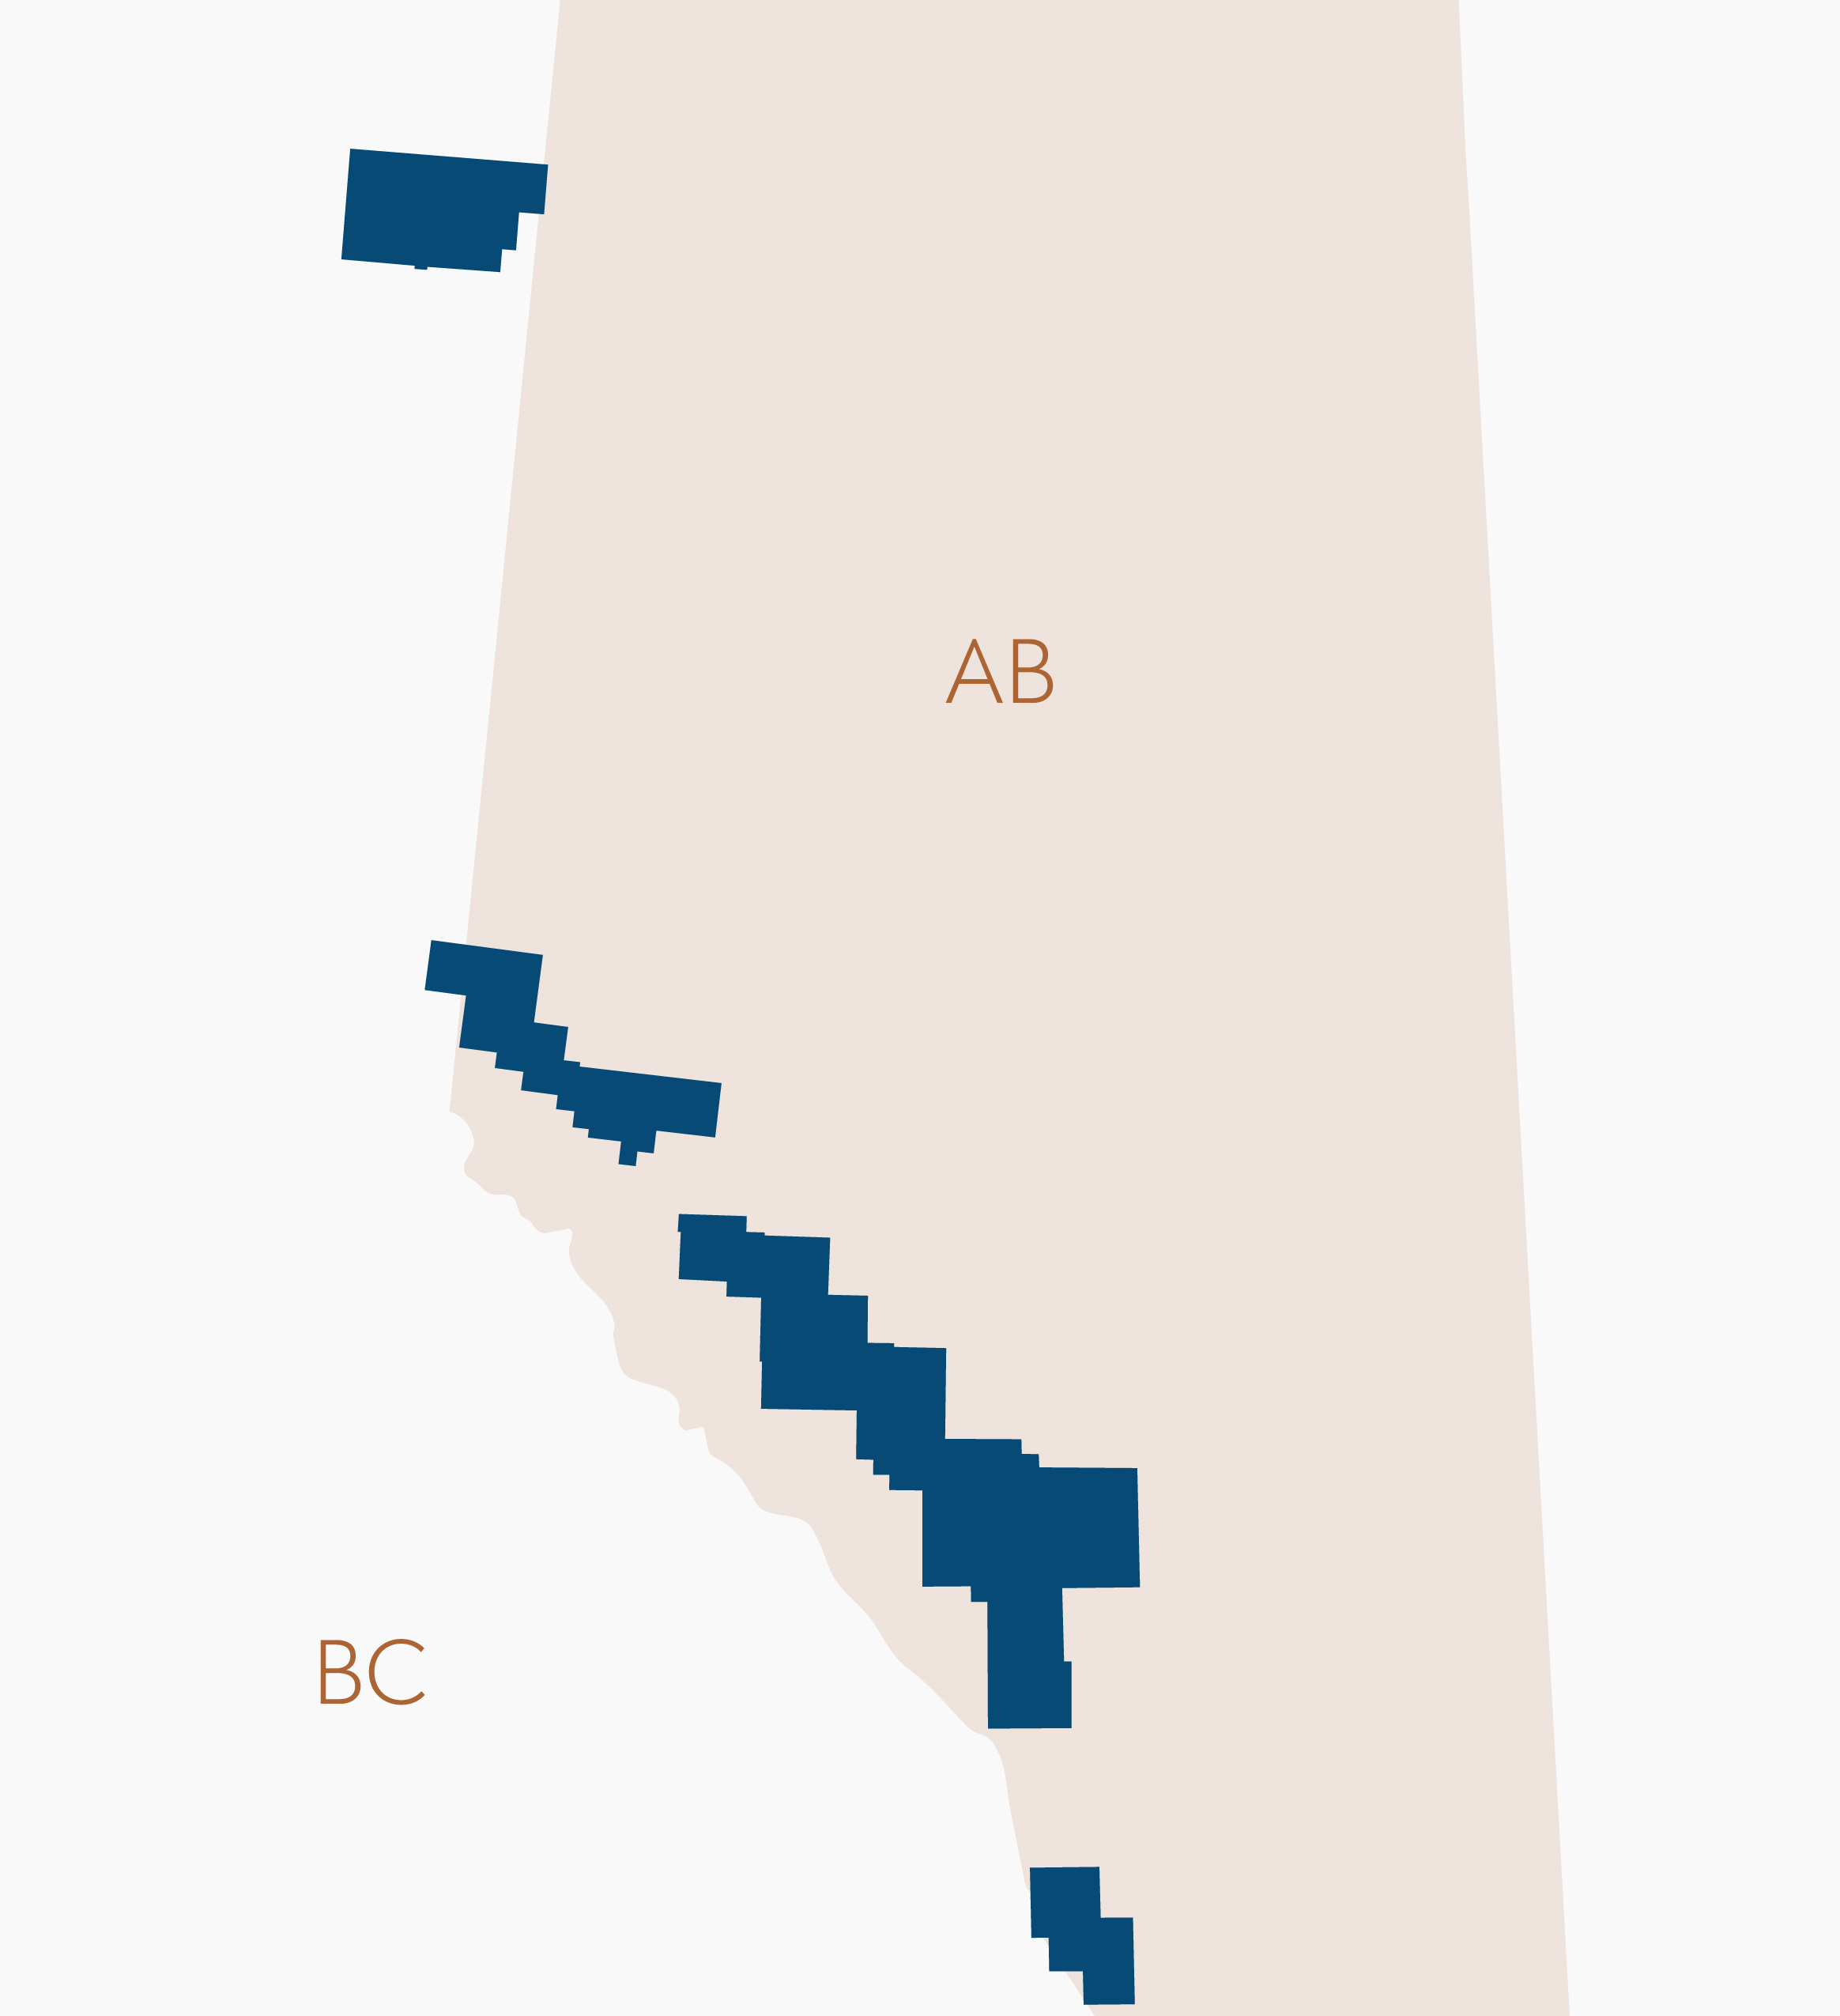
Over a million acres in the Foothills of the Rockies and Northern BC
Cavvy’s assets stretch from Southern Foothills near Waterton all the way up to Sierra/Ekwan in Northeast British Columbia. We work with our neighbours to be strong, reliable operators – supporting employment and local economies, and maintaining safe operations.
What We DoFinancial Tables
Selected Quarterly Operational & Financial Results
| Select Quarterly Figures | 2025 | 2024 | 2023 | |||||||||
|---|---|---|---|---|---|---|---|---|---|---|---|---|
| ($000s unless otherwise noted) | Q3 | Q2 | Q1 | Q4 | Q3 | Q2 | Q1 | Q4 | Q3 | Q2 | ||
| Production | ||||||||||||
| Natural gas (Mcf/d) | 115,467 | 126,198 | 105,338 | 111,787 | 115,196 | 157,077 | 175,356 | 174,211 | 155,763 | 159,427 | ||
| Condensate (bbl/d) | 2,258 | 2,507 | 2,454 | 2,149 | 2,191 | 2,472 | 2,781 | 2,384 | 2,020 | 2,300 | ||
| NGLs (bbl/d) | 2,454 | 2,524 | 2,574 | 1,788 | 1,726 | 2,210 | 2,613 | 1,921 | 2,273 | 2,216 | ||
| Sulphur (tonne/d) | 1,120 | 1,128 | 1,076 | 968 | 1,444 | 1,376 | 1,491 | 1,284 | 1,124 | 1,362 | ||
| Total production (boe/d) [1] | 23,956 | 26,064 | 22,584 | 22,568 | 23,116 | 30,861 | 34,620 | 33,340 | 30,253 | 31,087 | ||
| Third-party volumes processed (Mcf/d raw) [2] | 136,134 | 119,761 | 81,777 | 71,497 | 66,518 | 52,410 | 58,423 | 67,350 | 57,363 | 51,973 | ||
| Financial | ||||||||||||
| Natural gas price ($/Mcf) | ||||||||||||
| Realized before Risk Management Contracts | 0.66 | 1.73 | 2.24 | 1.55 | 0.77 | 1.14 | 2.53 | 2.32 | 2.65 | 2.39 | ||
| Realized after Risk Management Contracts [3] | 3.25 | 3.23 | 3.58 | 3.36 | 3.43 | 2.71 | 3.21 | 3.12 | 3.25 | 3.03 | ||
| Benchmark natural gas price | 0.62 | 1.72 | 2.14 | 1.46 | 0.68 | 1.17 | 2.48 | 2.29 | 2.59 | 2.40 | ||
| Condensate price ($/bbl) | ||||||||||||
| Realized before Risk Management Contracts | 82.65 | 84.60 | 95.15 | 94.87 | 92.13 | 99.96 | 91.18 | 97.15 | 97.47 | 84.81 | ||
| Realized after Risk Management Contracts [3] | 83.66 | 85.88 | 88.29 | 90.61 | 84.61 | 87.75 | 84.49 | 86.34 | 80.49 | 105.84 | ||
| Benchmark condensate price ($/bbl) | 86.58 | 87.71 | 100.24 | 98.85 | 97.10 | 105.62 | 98.43 | 104.30 | 106.30 | 93.25 | ||
| Sulphur price ($/tonne) | ||||||||||||
| Realized sulphur price [4] | 34.59 | 32.40 | 17.00 | 12.09 | 8.86 | 18.43 | 14.49 | 22.54 | 13.34 | 22.78 | ||
| Benchmark sulphur price | 264.38 | 373.11 | 246.36 | 180.54 | 128.47 | 103.19 | 94.84 | 118.29 | 107.09 | 114.92 | ||
| Net income (loss) [5] | (10,086) | 4,147 | 2,666 | (20,921) | 7,496 | (19,196) | (6,284) | 7,414 | (16,254) | 4,182 | ||
| Net income (loss) $ per share, basic | (0.03) | 0.01 | 0.01 | (0.08) | 0.04 | (0.12) | (0.04) | 0.05 | (0.11) | 0.03 | ||
| Net income (loss) $ per share, diluted | (0.03) | 0.01 | 0.01 | (0.08) | 0.04 | (0.12) | (0.04) | 0.03 | (0.11) | 0.03 | ||
| Net operating income | 30,631 | 26,491 | 32,550 | 13,720 | 19,818 | 7,652 | 23,418 | 25,441 | 11,650 | 43,843 | ||
| Cashflow provided by (used in) operating | 4,466 | 1,599 | 22,612 | (592) | 2,260 | (1,555) | 7,049 | 31,983 | 7,577 | 27,533 | ||
| Funds flow from operations [5] | 12,898 | 14,502 | 21,707 | 2,824 | 8,234 | (4,874) | 12,044 | 14,269 | (1,422) | 35,432 | ||
| Total assets | 536,274 | 553,216 | 571,470 | 612,423 | 615,040 | 585,940 | 590,531 | 638,541 | 564,921 | 575,849 | ||
| Adjusted working capital deficit [5] | (10,631) | (20,144) | (30,540) | (29,777) | (42,658) | (37,986) | (31,671) | (31,830) | (21,454) | (6,258) | ||
| Net debt | (163,697) | (166,878) | (185,438) | (197,56) | (206,77) | (219,20) | (209,96) | (204,04) | (205,53) | (181,67) | ||
| Capital expenditures [6] | 4,022 | 2,391 | 6,542 | 5,800 | 10,002 | 5,003 | 4,897 | 9,306 | 16,363 | 9,384 | ||
(1) Total production excludes sulphur.
(2) Third-party volumes processed are raw natural gas volumes reported by activity month, which do not include accounting accruals.
(3) Includes physical commodity and financial risk management contracts inclusive of cash flow hedges, (together “Risk Management
Contracts”). The realized natural gas price after Risk Management Contracts shown above is normalized to exclude the impact of the
hedge monetization.
(4) Realized sulphur price is net of customary deductions such as transportation, market and storage fees.
(5) Refer to the “Net Operating Income”, “Capital Resources”, “Funds Flow from Operations” and “Working Capital and Capital Strategy”
sections of the Company’s MD&A for reference to non-GAAP measures.
(6) Excludes reclamation and abandonment activities.
Analyst Coverage
Analyst Coverage Information
| Firm | Analyst |
|---|---|
| Ventum Capital Markets | Adam Gill |
| Schachter Energy Research | Josef I. Schachter |
Important Dates
Calendar
| Report | PERIOD ENDED | RELEASE DATE | CONFERENCE CALL |
|---|---|---|---|
| Annual Information Report | December 31, 2025 | March 18, 2026 (After Markets) | N/A |
| Year End 2025 | December 31, 2025 | March 18, 2026 (After Markets) | March 19, 2025 |
| Q1 2026 | March 31, 2026 | May 7, 2026 (After Markets) | AGM – See Below |
| Q2 2026 | June 30, 2026 | August 12, 2026 (After Markets) | August 13, 2026 |
| Q3 2026 | September 30, 2026 | November 4, 2026 (After Markets) | November 5, 2026 |
| Year End 2026 | December 31, 2026 | March 17, 2027 (After Markets) | March 18, 2027 |
Annual Meeting Information
AGM Details
The annual meeting of the holders of common shares of Cavvy Energy Ltd. was held on May 8, 2026 commencing at 1:30 p.m. (MST). The specific details of the matters proposed to be put before the meeting are set forth in the information circular dated March 24, 2026. The 2026 Management Information Circular can be found on Odyssey.
Investor Relations Contact